Engaged employees
create more satisfied customers.
Structured EMI and eNPS surveys that map engagement, leadership and workplace culture — with concrete action plans per group. There is a documented correlation between employee satisfaction and customer satisfaction.
Between employee satisfaction and customer satisfaction — engaged employees deliver measurably better customer experience.
For employees in highly engaged teams compared with low-engagement teams. Recruitment cost makes the survey pay for itself immediately.
We never report on groups with fewer than 5 responses — anonymity by design.
What an eNPS dashboard looks like
Engagement, leadership and culture broken down per office and team — with the anonymity threshold that guarantees confidentiality. Includes an action plan for each identified improvement area.
A complete picture
of the employee experience
We always start by understanding your business goals — then we choose method and design. The result is not just numbers but concrete action recommendations ranked by expected impact.
Engagement & loyalty
eNPS plus deeper drivers. Measurement of employees' willingness to recommend and what lies behind it — wellbeing, meaningfulness, ability to influence, balance. Per group but never below the anonymity threshold.
Leadership
Soft values measured rigorously. The immediate manager's communication, feedback, clarity and trust. Top-score benchmark against other organisations. Identifies leadership as a strength or a risk factor.
Risk factors for attrition
Early warning signals. Identifies groups with rising attrition risk before it happens — so you can act. Correlation analysis between engagement factors and historical departures.
Workshop support
Reports become action plans. We come on-site and run group-level workshops where employees themselves discuss the results and produce action plans. Included in every EMI engagement.
guide to
engagement measurement
The complete guide to engagement measurement
A 22-minute read written by Johan Asklund. eNPS, EMI, driver analysis and how to translate measurement results into action plans that actually get implemented. Concrete workshop templates and example questions included.
Read the guide →The entire employee journey
— from first day to last
Engagement is not created at a single measurable moment but over time. We measure all the phases where the relationship between employee and company is shaped.
Measurement points across the entire journey
We follow every phase — adapted to your business model — and measure both quantitatively and qualitatively.
Three KPIs that lead
Standardised key figures — comparable over time and against external benchmarks.
Concrete — not just an average score
For every insight we deliver:
Results per office, team or function — with the anonymity threshold that guarantees confidentiality.
Which factors correlate most strongly with eNPS and stay intent — so you know where the action will bite.
Groups with rising attrition risk are flagged immediately — for proactive follow-up.
On-site workshops where employees themselves develop the action plan. Included.
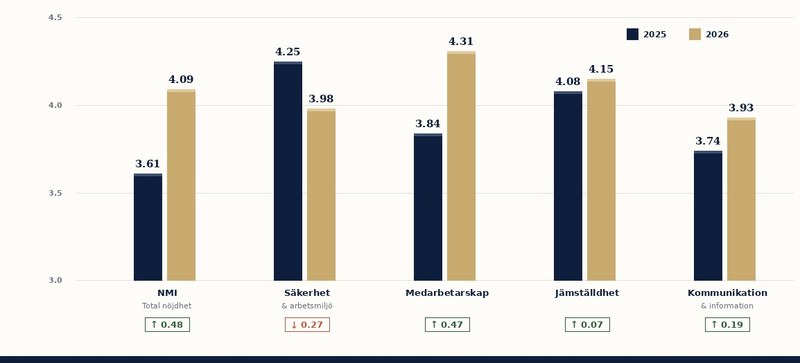
Examples from an actual report
Screenshots from an employee research project for a B2B manufacturer (anonymised). Delivered as Word + PDF + PowerPoint with executive summary, section analysis, department breakdown and concrete action proposals.
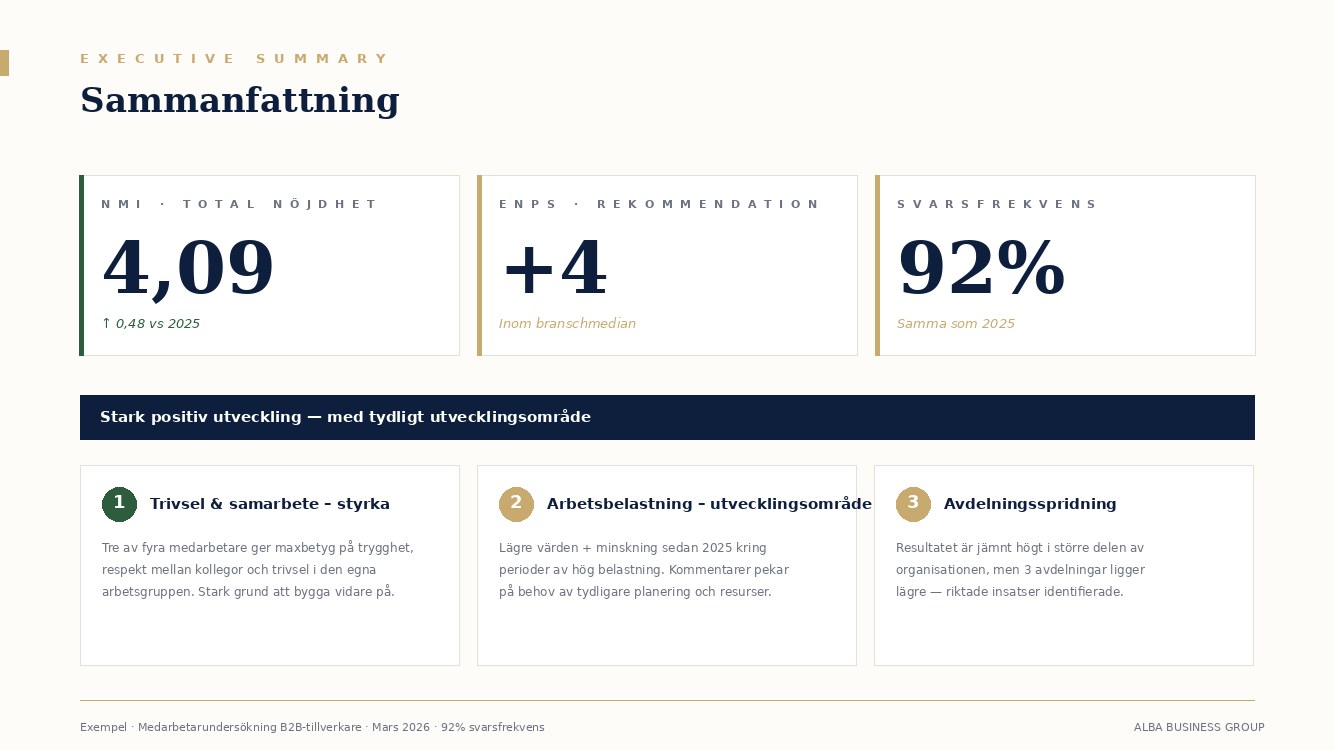
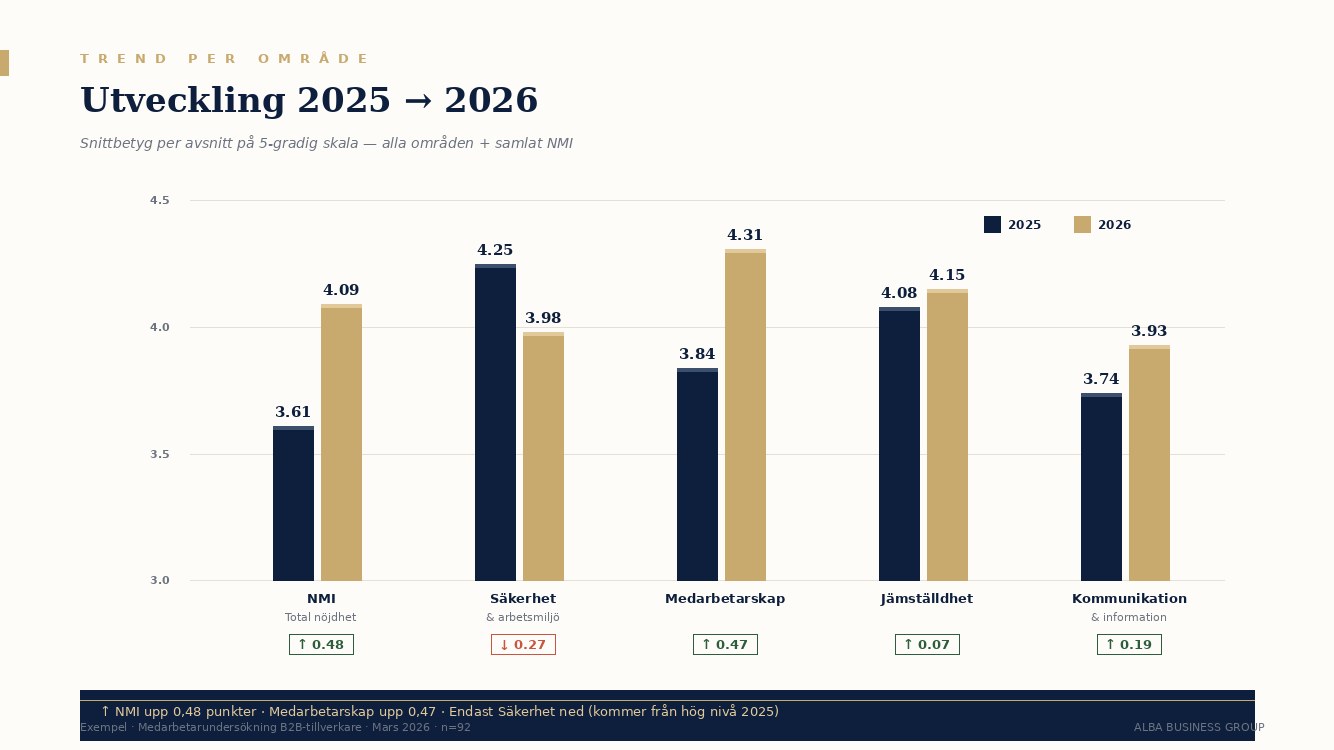
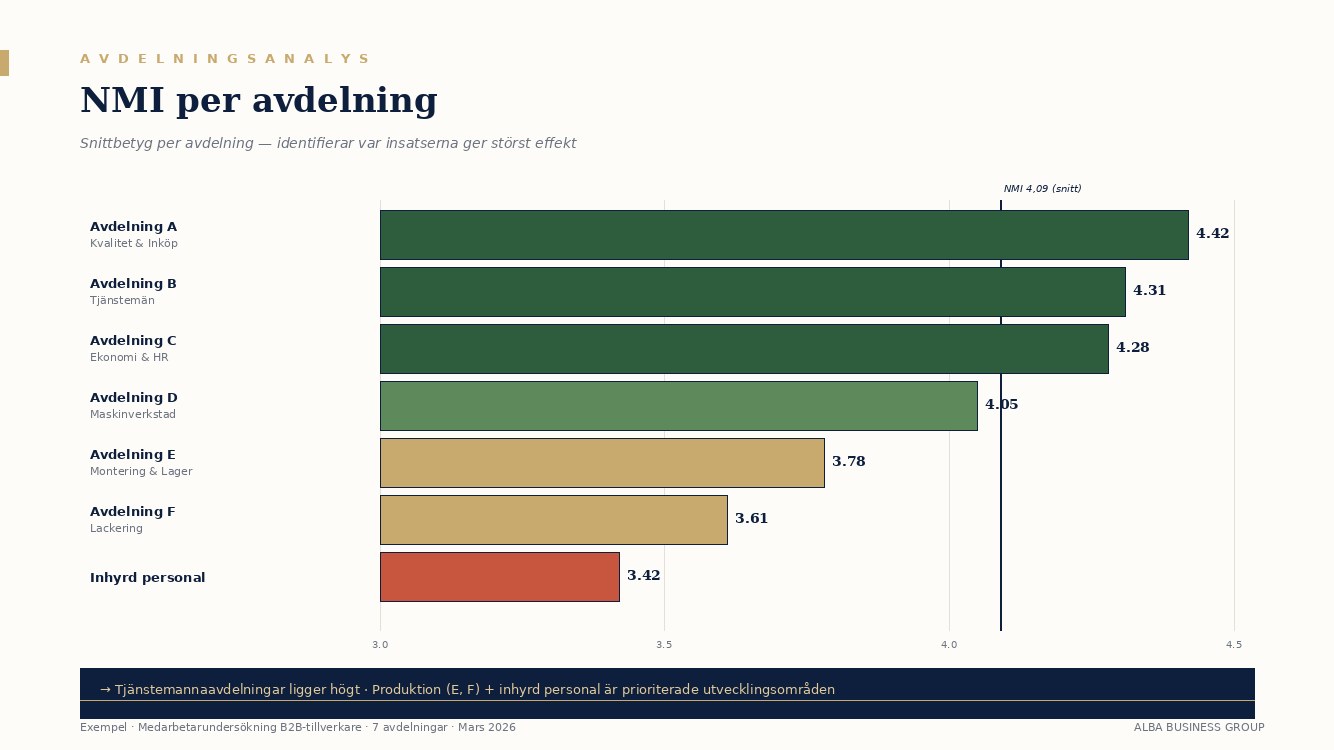
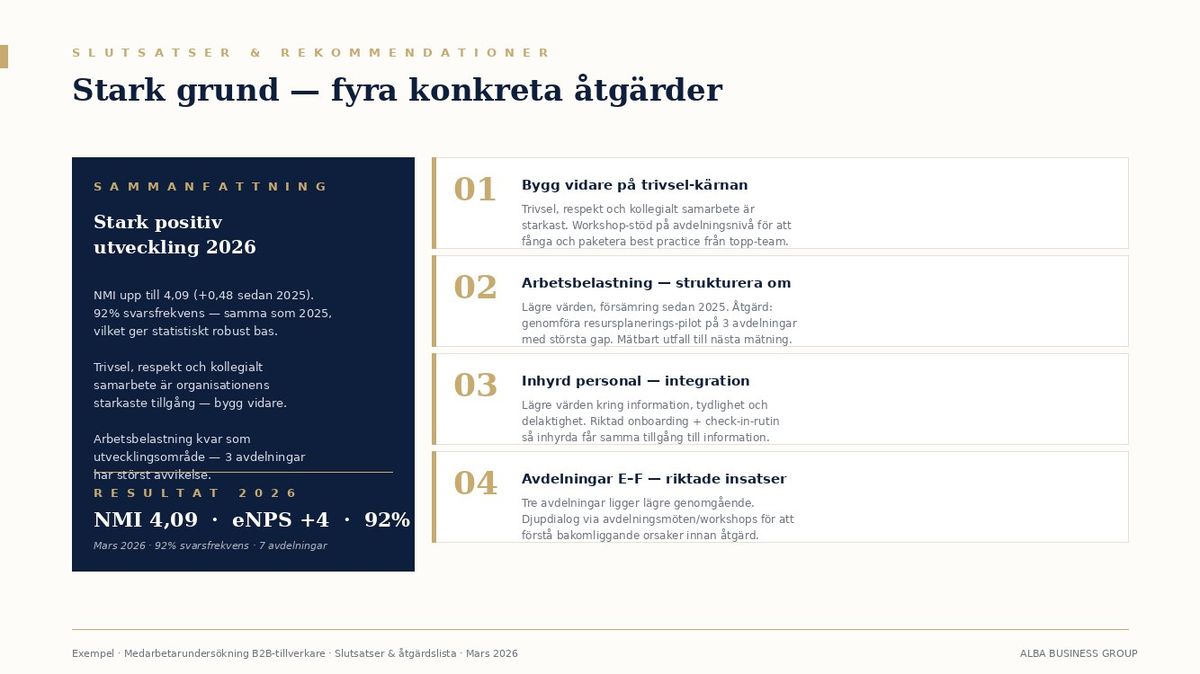
The images are from an actual delivery to a B2B manufacturer in March 2026 (92% response rate, 7 departments). Customer name, brand and respondent data have been removed or masked in the example.

"The workshops were the key. Having the employees themselves develop the action plan — instead of HR delivering it — was what made it actually happen. The eNPS lift was the result."
Want to know what drives
engagement in your teams?
Book 15 minutes and we will discuss your current situation, which groups you want to compare and how we design the survey to be anonymous yet still actionable.
15 min · free of charge · no preparation needed